Technical Indicators for Commodity Trading: Overview
Commodity trading has long been a cornerstone of global financial markets, enabling investors to hedge risk, speculate, and diversify their portfolios. Whether you are trading metals like gold and silver, agricultural goods like wheat and corn, or energy commodities like crude oil, knowing how to use technical indicators is key to making smart trading choices. Let us explore the most popular technical indicators for commodity trading, supported by real-world examples and industry statistics to help both beginners and experienced traders refine their strategies.
Why Technical Indicators for Commodity Trading Matter?
Technical indicators are mathematical tools that utilize an asset’s price, volume, or open interest to aid in analyzing market trends. In the context of commodities like gold, silver, wheat, natural gas, and crude oil, these indicators help traders:
- Identify market trends
- Spot overbought or oversold conditions
- Pinpoint potential entry or exit points
- Avoid emotional decision-making
They are not magic bullets, but when used correctly, they can drastically reduce risk.
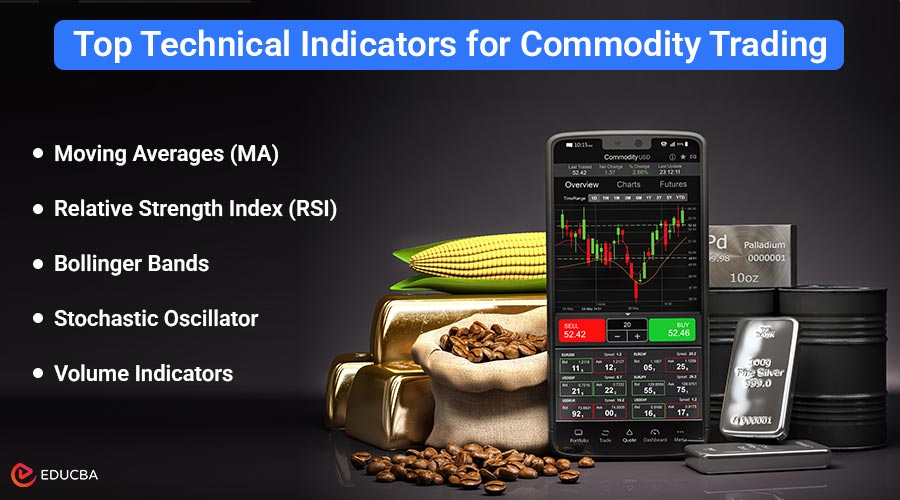
Top Technical Indicators for Commodity Trading
Technical indicators help commodity traders make informed decisions by analyzing price movements, volume, and momentum. Below are the top technical indicators widely used in commodity trading:
1. Moving Averages (MA)
Moving averages help smooth out price fluctuations to reveal the overall trend direction. They are lagging indicators, meaning they follow the price.
Types:
- Simple Moving Average (SMA): Average price over a period (e.g., 50-day SMA).
- Exponential Moving Average (EMA): Places more weight on recent prices; responds faster to changes.
How to Use:
- When the short-term MA (e.g., 50-day) crosses above the long-term MA (e.g., 200-day), it forms a Golden Cross – a bullish signal.
- A Death Cross, which indicates a possible negative trend, happens when the short-term moving average drops below the long-term moving average.
Example:
If the 20-day SMA of crude oil price rises above the 50-day SMA, traders may view this as a bullish signal, expecting prices to continue rising.
2. Relative Strength Index (RSI)
RSI is a momentum oscillator ranging from 0 to 100, indicating whether a commodity is overbought or oversold.
Key Levels:
- Above 70: Overbought – potential price correction.
- Below 30: Oversold – potential price rebound.
How to Use:
- Look for divergence: If the price makes a new high but the RSI does not, it may signal weakening momentum and a potential reversal.
- Combine with trend indicators to confirm direction.
Example:
In gold trading, an RSI of 75 following a strong rally may suggest it is time to secure profits before a potential pullback.
3. Moving Average Convergence Divergence (MACD)
MACD shows the relationship between two EMAs (typically 12-day and 26-day) and includes a signal line (9-day EMA of MACD).
How to Use:
- When the MACD line crosses above the signal line, it signals bullish momentum.
- When it crosses below, it signals bearish momentum.
- The histogram illustrates the gap between the MACD and signal lines, helping to gauge the strength of momentum.
Example:
For natural gas, a MACD crossover during a period of high demand (like winter) might signal a trend reversal worth trading.
4. Bollinger Bands
Bollinger Bands consist of:
- A middle band (usually a 20-day SMA)
- Upper and lower bands (2 standard deviations away)
They reflect volatility in price movements.
How to Use:
- Price touching the upper band = overbought.
- Price touching the lower band = oversold.
- A squeeze (narrowing bands) = upcoming breakout.
Example:
In soybean futures, a severe squeeze followed by a break above the upper band can indicate a bullish move due to a weather-related supply deficit.
5. Stochastic Oscillator
A momentum indicator that calculates the closing price of a commodity in relation to its range of prices over a given time frame.
Key Components:
- %K line (current closing vs. range)
- %D line (SMA of %K)
How to Use:
- Above 80: Overbought
- Below 20: Oversold
- Crossovers between the %K and %D lines signal buying and selling opportunities.
Example:
In corn trading, an oversold stochastic reading in harvest season can suggest undervaluation due to temporary overproduction.
6. Volume Indicators (OBV & VWAP)
Volume indicators measure the strength behind price movements.
- On-Balance Volume (OBV): OBV adds volume on days when prices rise and subtracts volume on days when prices fall. A rising OBV indicates buying pressure.
- Volume Weighted Average Price (VWAP): It displays the average price a commodity has traded at during the day, weighted by trading volume.
How to Use:
- Use OBV to confirm breakouts (e.g., if price rises and OBV rises too, the move is strong).
- Institutional traders often use VWAP to assess fair price levels.
Example:
In silver trading, a price breakout above resistance, accompanied by a rising OBV, could confirm a strong upward move.
7. Commodity Channel Index (CCI)
The CCI compares the current price of a commodity to its average price throughout time.
Key Levels:
- Above +100: Strong uptrend
- Below -100: Strong downtrend
How to Use:
- Over +100: Trend continuation or start of an uptrend.
- Below -100: Look for potential reversals or shorting opportunities.
Example:
In coffee futures, a CCI above +100 during a supply shock can be an entry signal for long positions.
Combining Indicators for Better Accuracy
Depending on just one indicator can give inaccurate or incomplete signals. Successful traders often combine two or more tools to strengthen their analysis.
Example strategy:
- Use RSI to identify overbought conditions
- Confirm with a MACD crossover for a possible trend reversal
- Use Volume to validate the breakout
For instance, when the gold price exhibits RSI divergence and a MACD bearish crossover, accompanied by declining volume, it may signal an upcoming correction.
Tips for Using Technical Indicators Effectively
- Customize Settings: Adjust parameters (like period length) to fit the specific commodity’s trading behavior.
- Consider Market Context: Align technical signals with news events and fundamental analysis to inform your trading decisions.
- Avoid Over-Reliance: Use technical indicators as tools, not as sole decision-makers.
- Backtest Strategies: Validate your indicator strategy using historical commodity data before applying it with real money.
Final Thoughts
Technical Indicators for Commodity Trading offer a powerful lens through which traders can interpret market trends, anticipate price movements, and manage risks effectively. From momentum tools like RSI and MACD to volatility gauges like Bollinger Bands, these indicators transform raw market data into actionable insights. While no indicator offers foolproof predictions, combining several tools—along with proper risk management—can significantly enhance your chances of making informed trading decisions.
Recommended Articles
We hope this guide on technical indicators for commodity trading helps you make smarter, data-driven decisions in volatile markets. Check out these recommended articles for more strategies, charting tools, and expert tips to refine your trading approach.
- How to Create a Trading Strategy?
- EV Stocks in India
- Market Volatility
- Retail Trading